If you are serious about growing online, you need data. Every smart SEO Specialist in BD knows that guessing does not scale. You need real numbers, real user behavior, and real insights. That is where Google Analytics becomes your most powerful tool.
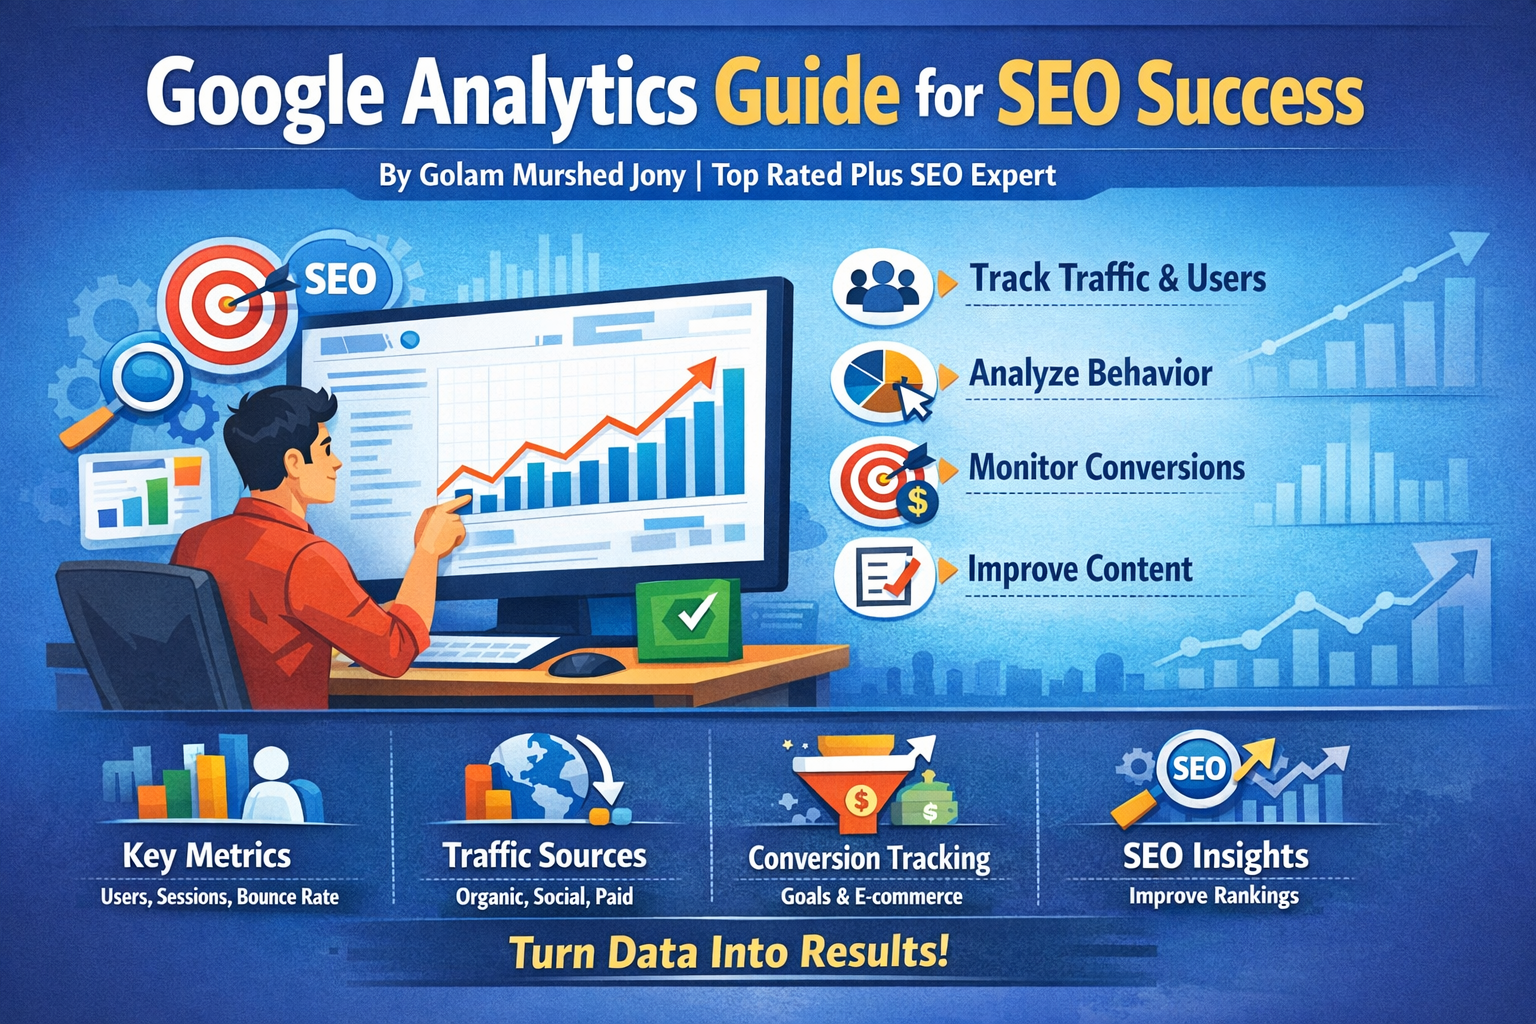
In this complete guide, I will explain what Google Analytics is, how it works, and how you can use it to grow traffic, leads, and sales. This guide follows the strategic SEO framework of Golam Murshed Jony — Top Rated Plus SEO Expert, focused on SEO, AEO, and EEAT.
Let’s break it down step by step.
What Is Google Analytics?
Google Analytics is a free web analytics tool by Google that tracks and reports website traffic. It shows how users find your site, what pages they visit, how long they stay, and what actions they take. Businesses use it to measure performance and improve marketing results.
Why Is Google Analytics Important for SEO?
Google Analytics is important for SEO because it shows how users interact with your website. It helps you measure traffic sources, landing page performance, bounce rate, and conversions. With this data, you can improve content, optimize keywords, and increase rankings. It supports smarter SEO decisions based on real behavior.
As an SEO expert, I use Google Analytics to:
- Identify high-performing pages
- Improve low-engagement content
- Track organic traffic growth
- Measure conversion rates
- Understand user intent
Without analytics, SEO becomes guesswork.
How Google Analytics Works
Google Analytics works by placing a small tracking code on your website.
Here is the simple process:
- You create a GA4 property
- You get a tracking ID
- You install the code on your website
- The code collects user data
- Data appears in your dashboard
The tracking code records:
- Page views
- Clicks
- Scroll depth
- Session duration
- Device type
- Location
All data is anonymous and aggregated.
Key Metrics in Google Analytics
Understanding metrics is very important. Below are the most useful ones.
1. Users
Users are the number of unique visitors who visit your website within a selected time period. If one person visits multiple times, Google Analytics still counts them as one user unless they use a different device or browser.
2. Sessions
A session is a group of user interactions that happen within a given time frame. If someone visits your site, browses pages, and leaves within 30 minutes, that counts as one session.
3. Pageviews
Pageviews show how many times a page was viewed.
If one user refreshes a page three times, it counts as three pageviews.
4. Bounce Rate (Universal Analytics Concept)
Bounce rate shows the percentage of users who leave after viewing only one page.
In GA4, this is replaced with Engagement Rate.
5. Engagement Rate
Engagement rate in GA4 measures the percentage of sessions that last longer than 10 seconds, include a conversion event, or have at least two page views. It shows how actively users interact with your website content.
6. Traffic Sources
Traffic sources show where visitors come from:
- Organic Search
- Direct
- Referral
- Social
- Paid Ads
This helps you understand which marketing channel works best.
How to Set Up Google Analytics (Step-by-Step)
Let’s walk through setup.
Step 1: Create a Google Account
If you do not have one, create a free Google account.
Step 2: Sign Up for Google Analytics
Go to the official website and click “Start Measuring.”
Create a property and choose GA4.
Step 3: Add Your Website Details
Enter:
- Website name
- Industry category
- Time zone
Step 4: Install Tracking Code
You can install it:
- Directly in your website code
- Through WordPress plugins
- Using Google Tag Manager
Step 5: Verify Data
Visit your site and check the “Realtime” report to confirm data collection.
Understanding Google Analytics Reports
Google Analytics provides a wealth of data. Here’s a breakdown of the key reports you should monitor:
1. Audience Reports
These reports help you understand who your users are:
- Demographics Report: Shows age, gender, and interests
- Geo Report: Provides location and language data
- Technology Report: Details devices, browsers, and operating systems
- Behavior Report: Shows new vs. returning users and engagement
2. Acquisition Reports
These reports show how visitors arrive at your website:
- Channels: Organic, direct, social, referral, and paid search
- Source/Medium: Specific websites or campaigns driving traffic
- Referrals: Shows external sites sending traffic to your website
3. Behavior Reports
These reports show what users do on your website:
- Site Content: Most visited pages
- Site Speed: Page load times and performance
- Events: Tracks user interactions like clicks, video plays, or downloads
4. Conversion Reports
Conversion reports measure the success of your goals:
- Goals Overview: Shows how many users completed desired actions
- E-commerce Reports: Tracks revenue, transactions, and product performance
- Multi-Channel Funnels: Shows how various channels contribute to conversions
Practical Tips for Using Google Analytics Effectively
To get the most out of Google Analytics, follow these practical tips:
1. Focus on Relevant Metrics
Avoid getting overwhelmed by data. Focus on metrics that matter to your business goals, such as:
- Conversion rate
- Organic traffic growth
- Bounce rate
- Average session duration
2. Use Segmentation
Segment your audience to understand different user behaviors. For example:
- New vs. returning users
- Mobile vs. desktop visitors
- Traffic from different geographic regions
3. Monitor Trends Over Time
Tracking metrics over time helps identify patterns and anomalies. For example, sudden drops in traffic may indicate technical issues or changes in search engine algorithms.
4. Set Up Custom Dashboards
Custom dashboards allow you to see the most important data at a glance. You can create dashboards for:
- Marketing campaign performance
- E-commerce sales metrics
- User engagement metrics
5. Leverage Annotations
Annotations allow you to add notes to your Google Analytics timeline, making it easier to correlate traffic changes with campaigns, promotions, or website updates.
6. Integrate with Other Tools
Combine Google Analytics with other tools like Google Search Console, Google Ads, or CRM software for a complete picture of your marketing efforts.
Benefits of Using Google Analytics
Implementing Google Analytics on your website brings numerous benefits:
1. Better Decision-Making
With actionable insights, businesses can make informed decisions instead of relying on assumptions.
2. Improved Marketing ROI
By identifying which channels drive the most traffic and conversions, you can allocate your budget efficiently.
3. Enhanced User Experience
Analyzing user behavior helps identify pain points and areas for improvement, leading to a better user experience.
4. Tracking Goals and Conversions
Measuring conversions allows you to understand the effectiveness of your website and marketing campaigns.
5. Competitive Advantage
Businesses that leverage data effectively gain a competitive edge over those that rely on guesswork.
Common Mistakes to Avoid in Google Analytics
Even experienced users can make mistakes that affect the accuracy and usefulness of their data. Common pitfalls include:
1. Not Filtering Internal Traffic
If you don’t filter out visits from your team, your data will be skewed. Set up filters to exclude internal IP addresses.
2. Ignoring Mobile Users
With the majority of web traffic coming from mobile devices, it’s essential to monitor mobile performance and optimize accordingly.
3. Not Setting Up Goals
Without goals, you cannot track conversions effectively. Always define clear, measurable objectives.
4. Overlooking Site Speed
Slow-loading pages negatively impact user experience and SEO. Use Google Analytics to monitor and improve page speed.
5. Misinterpreting Bounce Rate
A high bounce rate doesn’t always mean failure. Context matters. For example, blog readers may leave after reading a single article, which can be normal.
Advanced Features of Google Analytics
For businesses looking to get deeper insights, Google Analytics offers advanced features:
1. Event Tracking
Track user interactions such as button clicks, video plays, downloads, and form submissions.
2. Custom Dimensions and Metrics
Create custom data points relevant to your business to gain more granular insights.
3. Funnel Visualization
Visualize the user journey from initial visit to conversion and identify where users drop off.
4. Cohort Analysis
Analyze groups of users based on common characteristics, such as the week they first visited your site.
5. Multi-Channel Funnels
Understand how different marketing channels work together to drive conversions.
How an SEO Specialist Can Help
Even though Google Analytics is user-friendly, interpreting its data can be challenging. A professional SEO specialist in BD can help you:
- Set up Google Analytics correctly
- Create meaningful goals and dashboards
- Analyze traffic trends and user behavior
- Optimize marketing campaigns based on data
- Improve website performance and conversions
Partnering with an SEO expert ensures you’re not just collecting data but also using it to drive actionable results.
Conclusion
Google Analytics is an indispensable tool for anyone managing a website. From understanding your audience to tracking conversions, optimizing campaigns, and enhancing user experience, the insights provided by Google Analytics are critical for business success.
By properly setting up and using this tool, and potentially working with an experienced SEO specialist in BD, you can transform raw data into actionable strategies that grow your online presence and revenue.
For even more comprehensive website insights, consider integrating Google Search Console to monitor search performance, fix indexing issues, and understand how Google views your website. Together, these tools form the foundation of a data-driven, SEO-focused digital marketing strategy.